
Architected for Extreme Processing.
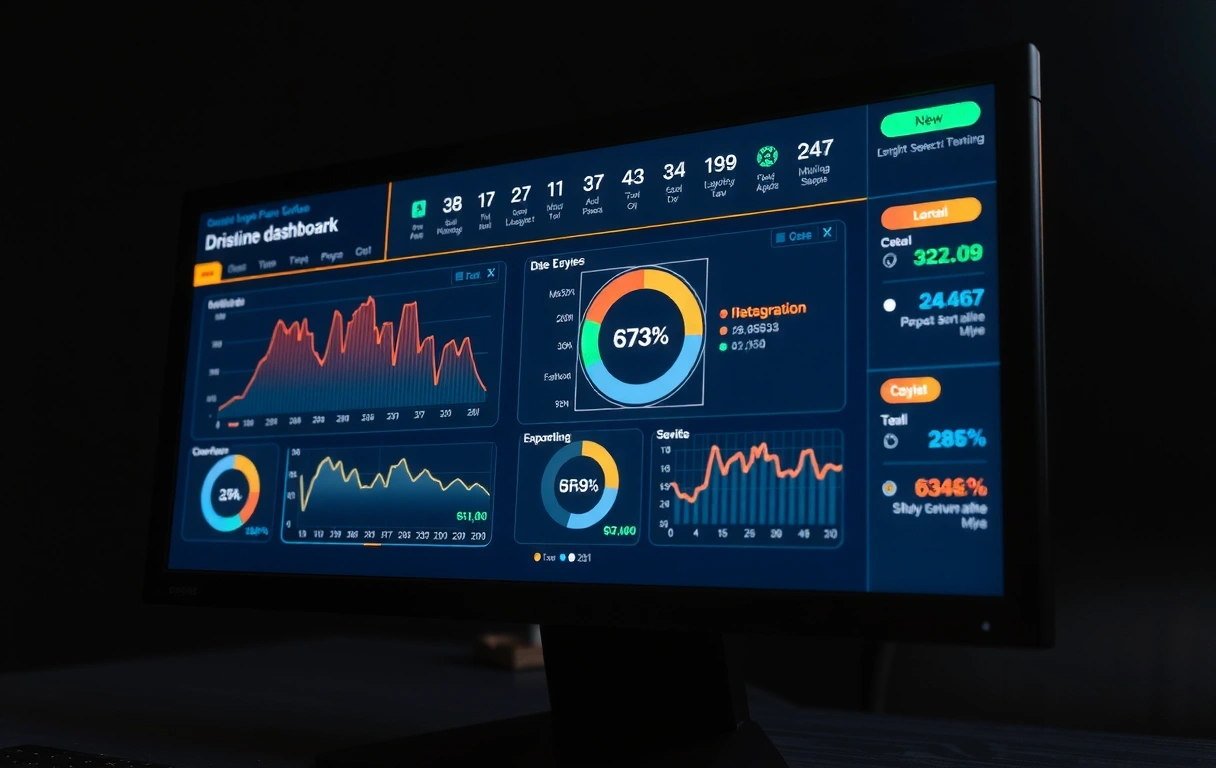
The SilkInsight dashboard isn't just a display; it is a high-frequency observation deck. We’ve engineered an interface where every pixel serves the data, reducing the latency between insight and action for mission-critical operations.
Granular Metrics Tracking Components
Precision requires more than generalities. Our dashboard breaks down complex data streams into four distinct operational pillars, allowing for surgical interventions and strategic oversight.
Throughput Volatiles
Monitor the raw speed of your data pipelines. Includes anomaly detection for sudden spikes in processing demand.
Resource Saturation
Visualizing the "ceiling" of your current infrastructure. Know exactly when to scale before the system bottlenecks.
Integrity Auditing
Verification metrics for every packet. We track the health of data as it transitions through various processing stages.
Predictive Drifts
AI-driven forecasting components that show where your metrics will be in 24 hours based on current velocity.
Mastering the Interface:
Operational Playbook
SilkInsight is built for depth. While the surface layer summarizes, the underlying interface allows for deep-dive exploration. Use these resources to calibrate your metrics dashboard for maximum utility.
-
01
Widget Customization
Drag-and-drop hierarchy based on role-specific KPI importance.
-
02
Alert Thresholds
Set logarithmic triggers to avoid notification fatigue during peak processing.
-
03
Dark-Mode Optimization
The interface uses high-contrast accessibility standards for long-duration monitoring.


"The challenge isn't collecting data; it's the cognitive load of interpreting it. Our dashboard features are designed to speak the language of 'Action' rather than 'Information'."
Dynamic Logic Engines
At the heart of SilkInsight Processing is our proprietary logic engine. Traditional metrics dashboards act as a mirror—merely reflecting what has already happened. Our features pivot this relationship toward foresight. By integrating automated data cleansing, we ensure that the metrics you see are stripped of noise and outliers that typically skew human judgment.
Furthermore, our integration with Bangkok's local infrastructure hubs means that regional latency optimization is built directly into the tracking components. You aren't just seeing data; you are seeing it at the precise moment it matters.
The Anatomy of an Insight
We define a "Feature" as a tool that reduces effort. Our customizable reporting modules allow you to export high-density data into stakeholder-ready visuals with a single click. This removes the "middleman" of manual data translation.
- Multi-tenant access levels for secure delegation.
- Encrypted telemetry for all processing logs.
- Real-time API response mapping.
Ready to calibrate your metrics?
Schedule a deep-dive walkthrough with our technical team in Bangkok. We'll show you how SilkInsight Processing fits into your existing ecosystem.